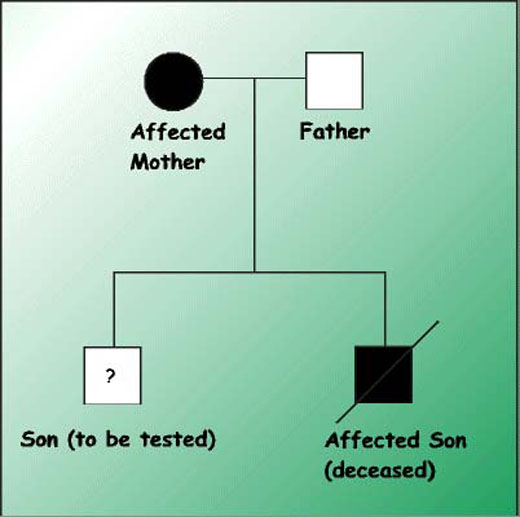
Family to be Tested
Two Dimensional Gene Scanning (TDGS) of the Retinoblastoma Gene
| Normal | Patient |
|---|---|
|
Size Separation of DNA
|
Size Separation
|
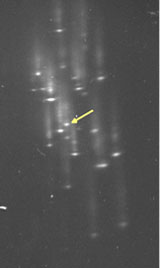
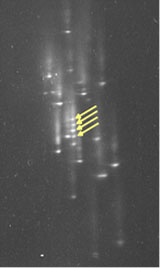
TDGS analysis allows rapid detection of genetic mutations in the RB1 gene.
The affected exon 18 (arrowed right panel) is clearly different to the normal control (arrowed left panel).
DNA Sequencing
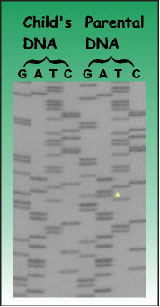 DNA sequencing of exon 18 derived from an individual with high retinoblastoma risk.
The DNA sequence (right four lanes) shows a mutation (asterisk) which changes an amino acid histidine to a tyrosine in the RB1 gene.
The patient's child (left four lanes) is clearly normal and has no risk of developing retinoblastoma or passing the mutation to the next generation.
Restriction Analysis
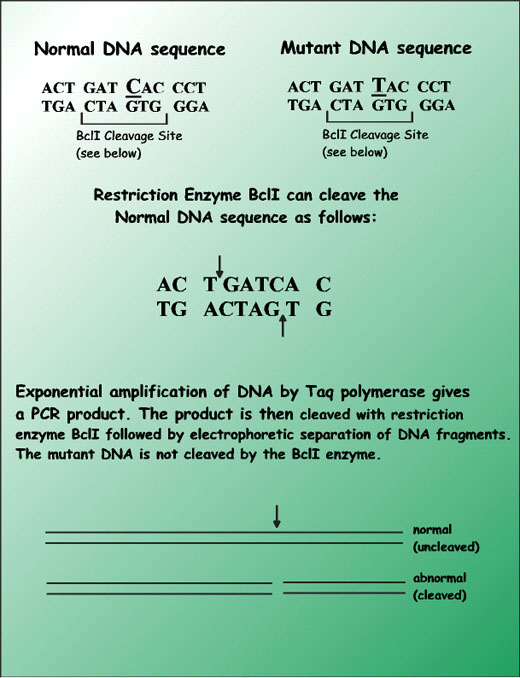
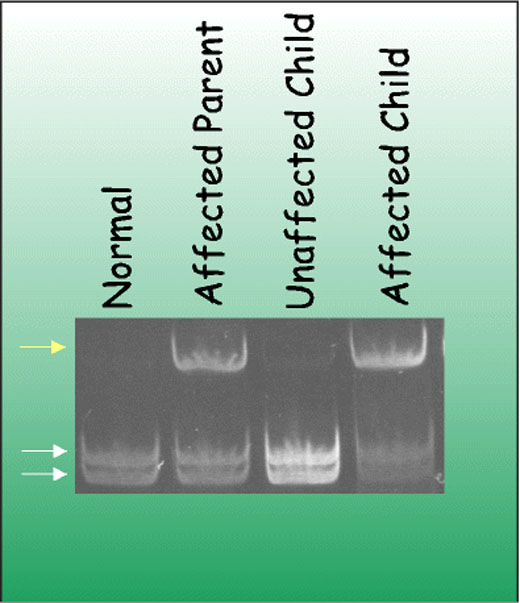
Tracking a retinoblastoma gene by restriction analysis.
After DNA amplification by the polymerase chain reaction, the mutant sequence (white arrow) is distinguished from the normal (yellow arrows).
The DNA from the affected child was derived from kidney tissue that had been preserved in wax.
These results indicate that the unaffected child has no genetically predisposing factors that can lead to retinoblastoma.