Collaborative Research Project
![]()
![]()
- P Ashley, University of New England, Australia
- D Craw, University of Otago, New Zealand
In collaboration with
- K Hunter, J McQuillan, OU Chemistry Department
- M Tighe, UNE Agronomy and Soil Science
About the project
This project is documenting the processes involved in mobilizing antimony from mineral deposits into the environment. The project looks at similarities and differences between antimony and arsenic mobility, as arsenic typically occurs with antimony in these deposits (commonly with gold as well). The project also examines what happens to the antimony when it passes into the environment.
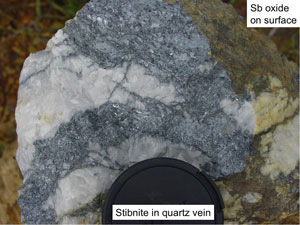 Figure 3. Coarse-grained stibnite crystals (needle-like, grey) forming clusters in white quartz vein material, Hillgrove mine, NSW.
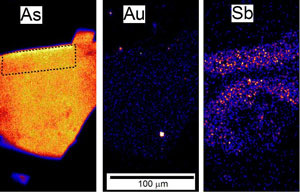 Figure 4. PIXE images (by B Petrie, and C Ryan) of an arsenopyrite grain. Coloured dots represent variable concentrations of elements. The shape of the grain can be seen in the left view which shows the arsenic distribution. The right view shows scattered antimony. The sample is from a gold mine, and gold grains are visible in the central image.
Source of antimony
The principal sources of antimony in these mineral deposits are:
- Stibnite, Sb2S3 deposited in veins with quartz (Fig. 3)
- Sb distributed through the mineral structure of arsenopyrite (FeAsS). The arsenopyrite can be in quartz veins, or in immediately adjacent rocks (Fig. 4)
Mineral deposits that have been examined as part of this programme include:
- Hillgrove antimony-gold mine, New South Wales (Figs 5,6,7)
- Endeavour Inlet historic antimony mine, Marlborough, New Zealand (Figs 8,9,10)
- Reefton gold mines, West Coast, New Zealand (Figs 11,12)
Hillgrove antimony-gold mine, New South Wales
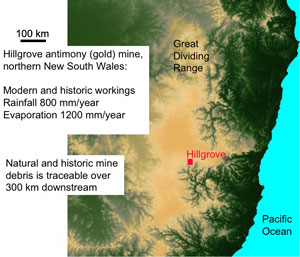 Figure 5. Aerial view of the location of Hillgrove mine in NE New South Wales. The mine is above the steep gorges of the Great Dividing Range, in the Macleay River catchment. The dark sinuous gorges of this catchment extend from the mine to the Pacific Ocean.
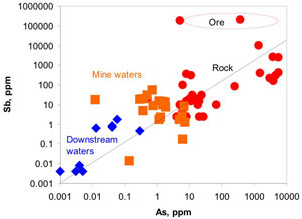 Figure 6. Comparison of concentrations of antimony and arsenic in Hillgrove mine rocks and waters. The diagonal line represents equal concentrations of the two elements. Hillgrove is strongly enriched in antimony.
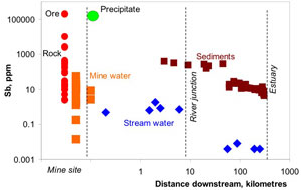 Figure 7. Concentrations of antimony in rocks and sediments from Hillgrove mine down the Macleay River catchment to the Pacific Ocean. "Precipitate" represents brown iron oxyhydroxide material that has been deposited from mine waters. This material is extremely rich in Sb. Precipitation of the is instrumental in extracting Sb from the mine waters before they discharge into the environment. Elevated Sb in Macleay River waters 300km downstream from the mine results from dissolving of Sb from sediments that were discharged from the mine historically. Natural Sb-rich sediments occur in the river also, from erosion of stibnite-bearing rocks.
Endeavour Inlet historic antimony mine, Marlborough, New Zealand
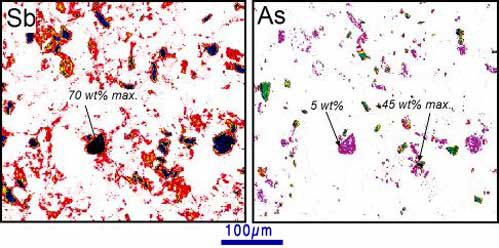
Figure 8. Electron microprobe images (by N. Wilson) of historical (100-year old) mine tailings at Endeavour Inlet antimony mine. The images show concentrations of antimony (left) and arsenic (right). Prominent equant grains are stibnite (70 wt%) Sb) and arsenopyrite (45 wt% As). Stibnite also contains up to 5 wt% arsenic. Diffuse lower Sb and As distributions in the images are due to rainwater dissolution and redeposition associated with iron oxyhydroxide.
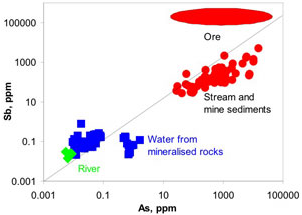 Figure 9. Comparison of antimony and arsenic concentrations in rocks, sediments, and waters downstream of Endeavour Inlet mine tunnels. Diagonal line represents equal amounts of Sb and As. Ore from the mines is strongly enriched in Sb, but sediments and some waters are relatively enriched in As.
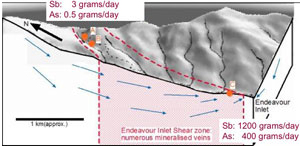 Figure 10. Three-dimensional block diagram of the Endeavour Inlet antimony mine area, showing groundwater movement through the antimony-bearing rocks. The amounts of antimony and arsenic discharged to the environment from mine tunnels are shown at top left. Total discharge of antimony and arsenic from the river is shown at bottom right. Nearly all the Sb and As discharge is from natural groundwater dissolution.
Reefton gold mines, West Coast, New Zealand
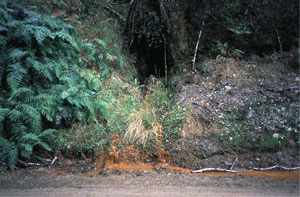 Figure 11. Historic gold mine tunnel near Reefton, showing water discharging with abundant brown iron oxyhydroxide precipitates. These precipitates are rich in antimony and arsenic.
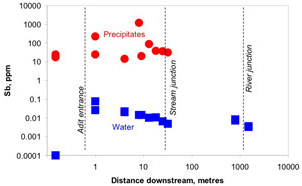 Figure 12. Antimony content of waters and brown iron oxyhydroxide precipitates, Reefton area. The precipitates are effective at removing most of the Sb from the water before it discharges into nearby streams.
Chemical controls of antimony mobility
Sulfide minerals stibnite (Sb2S3) and arsenopyrite (FeAsS) are unstable in the presence of atmospheric oxygen. They decompose, and antimony forms oxide minerals or goes into solution.
This is summarised in the following diagram, that shows the principal chemical reactions that occur during decomposition of stibnite. The oxide minerals commonly form a white coating on the outside of stibnite samples. This white coating is soluble in rainwater and river water, up to about 50 parts per million (10,000 times drinking water limits).
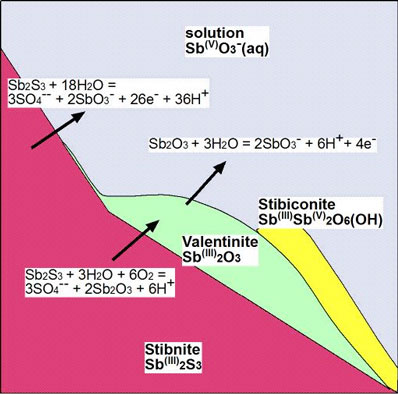
Figure 13. Cartoon showing mineral transformations and chemical reactions associated with decomposition of stibnite during oxidation. Sb (iii) is antimony in the 3+ oxidation state, and Sb (v) is antimony in the 5+ oxidation state.
See also "Mobilisation and dispersal of antimony from antimony-gold mineral deposits in circumneutral pH waters: environmental consequences in Australasia" by Ashley, Craw & Tighe, presented at the International Sb Workshop in Heidelberg, Germany, May 2005
References
- Craw, D, Wilson, N & Ashley, P M. 2004. Geochemical controls on the environmental mobility of Sb and As at mesothermal antimony and gold deposits. Applied Earth Science (Trans. Inst. Min. Metall. B) V113: B3-B10.
- Wilson, N J, Craw, D. & Hunter, K. 2004. Contributions of discharges from a historic antimony mine to metalloid content of river waters, Marlborough, New Zealand. Journal of Geochemical Exploration 84: 127-139.
- Ashley, P M & Craw, D. Structural controls on hydrothermal alteration and gold-antimony mineralisation in the Hillgrove area, NSW, Australia. Mineralium Deposita 39: 223-239.
- Wilson, N J, Craw, D & Hunter, K. Antimony distribution and environmental mobility at an historic antimony smelter site, New Zealand. Environmental Pollution 129: 257-266.
- Wilson, N J, Hunter, K A, Craw, D. 2002. Elevated arsenic and antimony levels in a South Island mesothermal mineralized zone. The AusIMM 2002 Annual Conference, Auckland, New Zealand, p 81-86, Publication Series no 6/02.
Related
Introduction
Overview: Geological setting for Metals in the New Zealand environment
- Epithermal Gold
- Mesothermal Gold
- Acid Rock drainage
- Coal
- Metals in groundwater
- Alluvial Gold
- Northland Mercury
- Hot Springs (in heavy metals)
Metalloids
- Arsenic
- Antimony
- Antimony mobilisation from mineral deposits in schist and greywacke
- Mobilisation and dispersal of antimony from antimony-gold mineral deposits
- NZTEG 2008 - Antimony in the New Zealand environment