Installation of signs
Signs can be used as a handheld resource, printed and attached to clipboards, or installed officially in consultation with local council and community groups.
Some of the signs are suitable for specific habitats or have been developed for a local area (John Wilson Drive and Te Rauone).
All the signs can be adapted for other sites by modifying the text, imagery or statistics. We strongly encourage engaging local iwi in discussions around the cocreation of signage and resources. For example, you can ask what kai moana, whakataukī, pūrākau or patterns could be incorporated for a specific local area for signs like “Kaimoana”, “Patterns of Place” and “Coastal Compromise”. It is also essential to have proper consent from iwi, hapū and council groups before physically installing these signs.
Species ID
There are some great resources for identifying marine animals and plants:
Marinelife, run by the NZ Marine Studies Centre, provides an online database of local marine species to explore.
http://www.marinelife.ac.nz/
A short overview of marine adaptations:
https://www.sciencelearn.org.nz/resources/142-marine-organisms-and-adaptations
iNaturalist is an online community where you can share your observations with fellow naturalists and discuss what you found! Experts assist with identifications, and scientists can use your observations in their research.
https://inaturalist.nz/
By iNaturalist, Seek is a mobile phone app that allows you to identify species with your phone's camera. It is very user-friendly and does not require signing up to use.
https://www.inaturalist.org/pages/seek_app
NZ Birds Online is a digital encyclopedia of NZ birds.
https://www.nzbirdsonline.org.nz/
eBird is a global citizen science project that allows you to record and share bird sightings, pictures, and audio online.
https://ebird.org/newzealand/home
Citizen Science
Here are some ways to contribute to citizen science projects:
A local iNaturalist project, SharkSpy is gathering data on shark observations around NZ.
https://www.inaturalist.org/projects/shark-spy
Marine Metre Squared (MM2) is a citizen science project that focuses on the biodiversity you find in a square metre of coast. You can upload your observations and consult experts.
https://www.mm2.net.nz/
Litter Intelligence is a long-term programme that collects litter data, provides powerful insights about the problem, and inspires widespread action for solutions.
https://litterintelligence.org/
Beach clean ups
The ocean carries so much of our rubbish. Every day ~ 8 million pieces of plastic enter the ocean where they are mistaken for food by birds & many sea creatures, even the fish we eat. With each tide some of this rubbish returns briefly to shore.
There are certain spots along the coasts where rubbish accumulates more than others. Try to site the “Representing Rubbish” activation where there is increased marine rubbish washing up with the tide.
In this activity, where we are encouraging gathering rubbish, you could link this activity to a beach clean-up challenge, especially if the location is known to accumulate rubbish. Encourage participants to remove this trash when they leave and consider supplying a location to dispose of what they collect.
A record of rubbish collected can be logged with Sustainable Coastlines and Litter Intelligence a NZ citizen Science project:
https://sustainablecoastlines.org/
https://litterintelligence.org/
You can try using this Ocean Plastic Simulator made by the Cawthorn Institute to see where plastic near you travels around New Zealand:
https://oceanplasticsim.cawthron.org.nz/wheres-our-plastic-going/
Photopoints
The “Shifting Sands” activation was made for John Wilson Drive, and Te Rauone, Dunedin. But the idea is suitable for any sandy shoreline, just modify the text, imagery and statistics for your site.
Photopoints are a modern method of monitoring change over time. Choosing where to position a photopoint is important because you want to be able to return over and over to capture an image and directly compare with past images.Elevated sites with unobstructed views along a coast are ideal.
Coastsnap is an existing tool and resource for coastal monitoring developed by the University of New South Wales.
https://www.coastsnap.com/
CoastSnap has a mobile phone app through which users can upload images of a coastline to help monitor changes over time. CoastSnap offers installation plans and guidance for phone camera cradles.
Black and white photo filters
The “Living History” sign was made for Te Rauone, Dunedin (this is where the photograph and the well-known painting are of). But you can make this activation work anywhere and substitute local pictures and/or artwork. Good places to check or ask about historic photos or paintings would be local museums, art galleries, newspapers, or members of the community. Remember to always request permission and cite appropriately.
If there is no existing artwork, consider making one from a photo as an example:
Android
After opening your camera app, follow this guide:
![]()
![]()
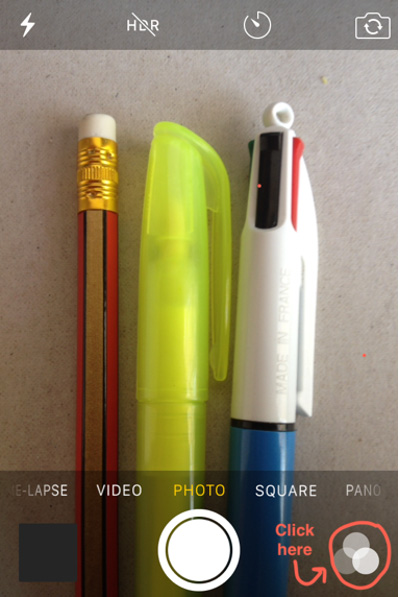
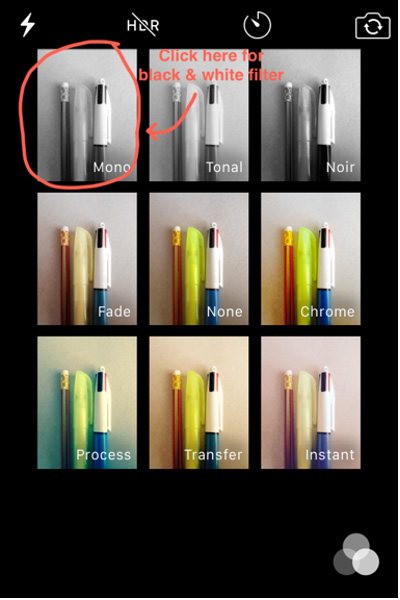
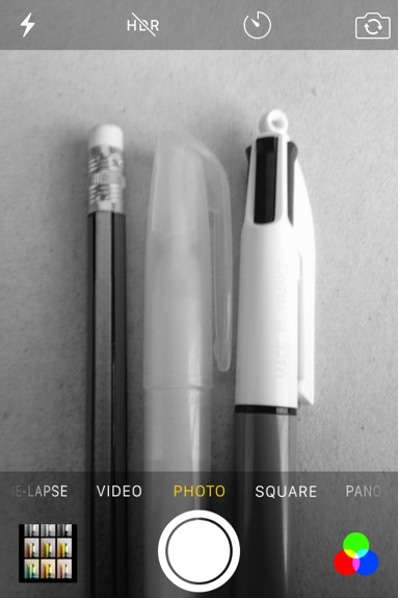
iPhone
After opening your camera app, follow this guide:
New Zealand geology
Local geology changes throughout New Zealand, and researching the geology of your region can add to the outcomes of activations. (In “Adopt a Rock” we have referenced rocks in the Otago Harbour and their potential age and origin.)
General information and overview of New Zealand geology:
https://teara.govt.nz/en/geology-overview
https://www.gns.cri.nz/Home/Our-Science/Land-and-Marine-Geoscience/Regional-Geology/The-Geology-of-New-Zealand
Tides
The effects of tidal flow are best seen in narrow channels, places with flowing seaweed attached to rocks, areas where boats are moored, buoys, or stationary objects like channel markers. Try to position this activation where there is at least one indicator of tidal flow.
The tides are different throughout New Zealand. Local tide charts can be found printed in most newspapers, but you can also explore these websites:
Tidespy:
https://tidespy.com/
Metservice Tides:
https://www.metservice.com/marine/tides
A quick overview and visuals of how tides work:
NOAA:
https://scijinks.gov/tides/
https://oceanservice.noaa.gov/facts/springtide.html
NASA:
https://moon.nasa.gov/resources/444/tides/
Links to Maramataka:
https://teara.govt.nz/en/maramataka-the-lunar-calendar
Kaitiakitanga
You can find further information to support the “Kaitiakitanga” activation here:
https://teara.govt.nz/en/kaitiakitanga-guardianship-and-conservation
Ngāi Tahu kaitiakitanga examples:
https://ngaitahu.iwi.nz/environment/
Discussions with local stakeholders should always include iwi representatives. We encourage engaging local iwi in discussions around the co-creation of this signage/resource. Any Māori placenames or te reo words used on materials should be discussed with iwi. Reach out and ask if there is anything relating to local kaitiakitanga that would suit the sign's message and if they would like to share anything in this medium.
Journaling
Consider starting a journal to record your naturalist observations and compare throughout the seasons. Adding sketches and reflective creative writing will add greater depth to your place-based awareness.
For example:
https://www.naturejournalingweek.com/blogs/what-is-nature-journaling
Getting Started with Nature Journaling:
https://youtu.be/wK2BTqUmBc4
"The pleasures, the values of contact with the natural world, are not reserved for the scientists. They are available to anyone who will place himself under the influence of a lonely mountain top – or the sea – or the stillness of a forest; or who will stop to think about so small a thing as the mystery of a growing seed."
Rachel Carson
Social media
To share observations digitally, you can create a unique hashtag on social media. For images, this is particularly useful in Instagram. Hashtags, like the below examples, “tag” a photograph taken by an individual and places it alongside other photos tagged with that same hashtag. If they have a public account, anyone searching or following that hashtag could see their image. Hashtags act like an indexing system and catalogue (e.g. #marinescienceotago).
Social media hashtag overview
https://help.instagram.com/466210366861501
By creating a unique hashtag, you offer an easy way for users to share their images with a larger community. It is also easy for you as a curator of these images, as this Instagram hashtag acts as a repository for images as well as a way for community members to stay involved by “following” the hashtag.
Depending on how you want to use the images/data collected, you may also want to set up a Facebook page or email address for submissions as well.
We encourage sharing of the data whenever possible, as if you are asking users to share their photos, they probably are interested in how their photos compare to others'. Please note that if you choose an email option that the curation, sharing, and storing of the photos will require effort. This is why we suggest something like a social media hashtag which is more self-sustaining.
Patterns
The “Patterns of Place” activation is suitable for sandy beaches, ideally at a site overlooking the beach. Check for local Māori tukutuku patterns relating to the sea. We encourage engaging local iwi in discussions around the co-creation of this signage/resource. Reach out and ask if there are local tukutuku panels that would suit the sign's message and if they would like to share these on this sign. You might also think of patterns that natural objects in a place might make (e.g. if you applied ink to a snail and rolled it on paper).
Some physical installations like a wind sock, anemometer, or weather vane could add depth to this sign by being able to note current weather conditions and compare them to patterns seen (e.g. wave height/direction and current wind direction and speed) - see Weather Forecasting.
Making sound maps
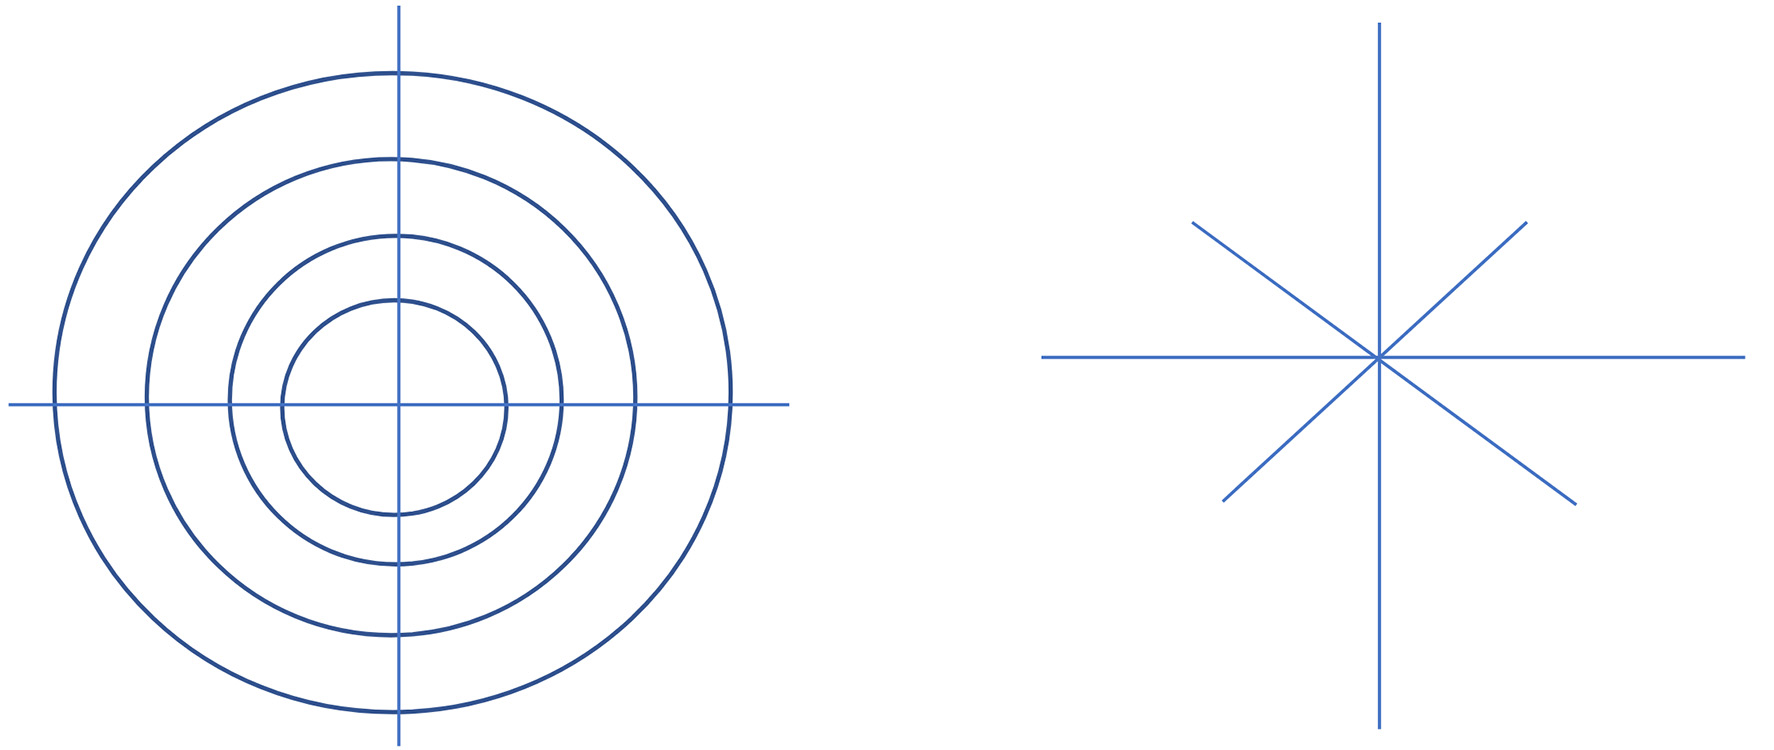
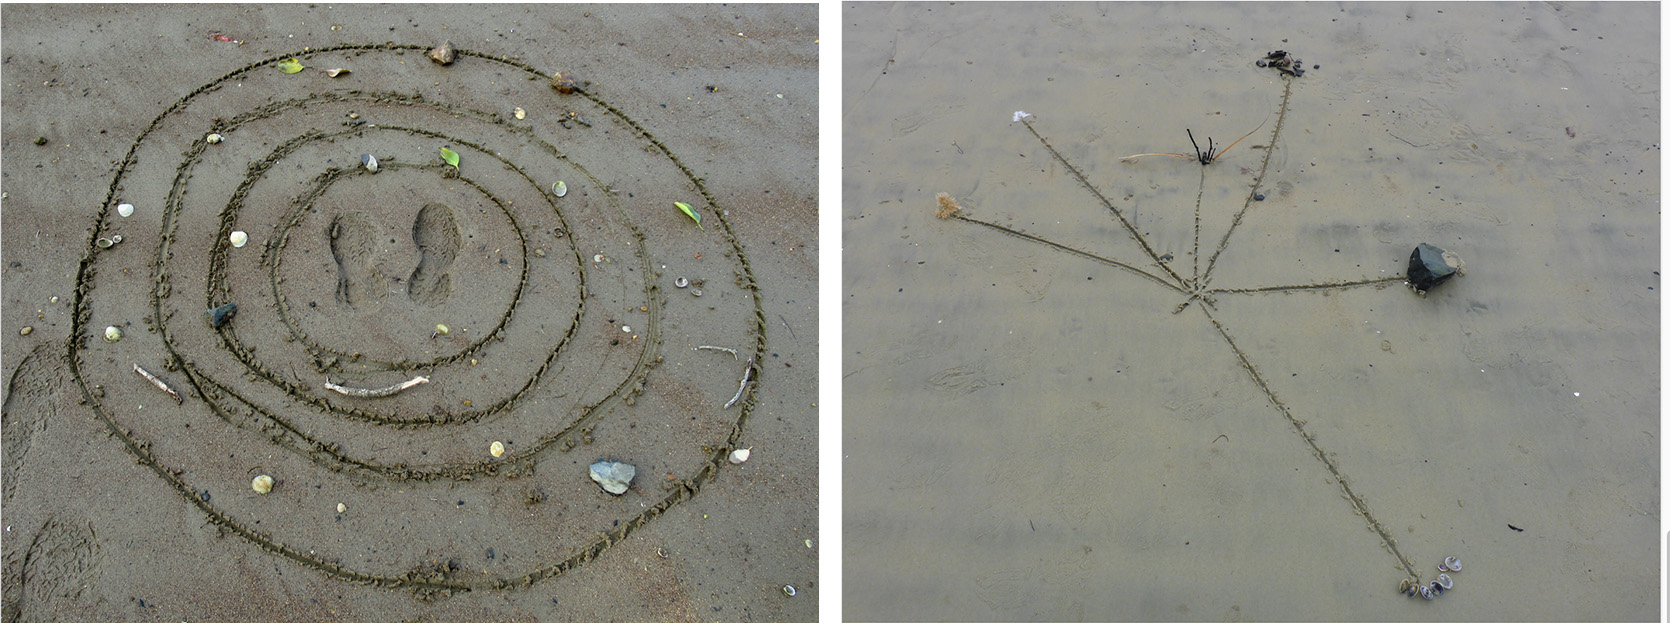
The “Sounds by the Sea” activation is best suited for sandy beaches and tidal estuaries. Depending on the suitability of your site, consider directing users to draw their soundmaps in the sand or gather objects around them. These two templates are to aid mapping the sounds around you. The left option uses concentric rings that help represent distance from you in the centre.
These could be as simple as “near,” “close-by,” and “far” or be a set distance like 10-metre intervals. The second option on the right uses directionality and your marks on the paper will determine relative distance to you, again at the centre. These are just examples – try any variations that work best for you!
Weather forecasting
In addition to forecasts in newspapers, there may be local resources that provide actual weather data for both the air and sea conditions (e.g. local weather stations, universities, port companies, etc.)
You can also explore NZ Metservice data for your region:
https://www.metservice.com/national
Additional installations alongside this sign might include an inexpensive thermometer in a protected box where users can check the temperature, a wind sock or weather vane, and a durable thermometer attached by a line to a wharf that can be lowered into the water and retrieved. More advanced installations are possible with electronic weather stations (solar powered or otherwise). These can include digital displays of air and sea temperatures, wind strength and direction, and tidal variation. Installation alongside technology can add depth to this sign by being able to note current weather conditions compared to what they are feeling.
Sand dunes
The “Cycling of Sand” activation was made for John Wilson Drive, Dunedin. But it is suitable for any sandy shorelines with dunes that have been notched to retain sand. Alternatively, see below. Highlight any human intervention taken at the installation site to limit erosion and/or aid accretion (e.g. planting, groynes, rock walls, fencing, staircases, notching). Where this sign is placed can help focus readers' attention to these efforts. Reword the text and update the statistics for your local area.
Local research can yield historic records or images that might be useful to highlight the changes to the coastline over time. Check with local councils or port companies for any sedimentation or erosion data.
If your local council or community is involved in dune restoration or protection, perhaps ask if you can help. Consider organising an event to help replant dunes, cordon off sensitive habitat like bird nesting sites, or 'adopt-a-notch' or 'adopt-a-dune' and monitor the changes to the coastline during your visits to your local beach.