Our changing landscape
Recent observations
We will use this page to share some recent work the Matariki team has done to document and quantify landscape change in Aotearoa New Zealand.
Mt Tasman rock avalanche, Aoraki Mount Cook National Park, February 2022
After recieving information from the Department of Conservation about a recent rock avalanche from Mt Tasman in Aoraki/Mount Cook National Park that occured after significant precipitation (likely between February 2-4) the Matariki team tested our full rapid-response mapping and 3D change detection system. We acquired the first cloud-free Sentinel 2 (ESA) and PlanetScope (Planet Labs) satellite images on February 6th and 8th for initial assessment, and via international collaborators (PGO/CNES) aquired high-resolution Pléiades imagery from February 8th. Image processing enabled Simon Cox (Matariki team member at GNS Science) to assess the hazard and update the inventory of landslides and other mass movements in the Southern Alps.
You can view the initial PlanetScope imagery (Planet Labs, 2022) below at several scales.
Rapid-response 3D topographic mapping
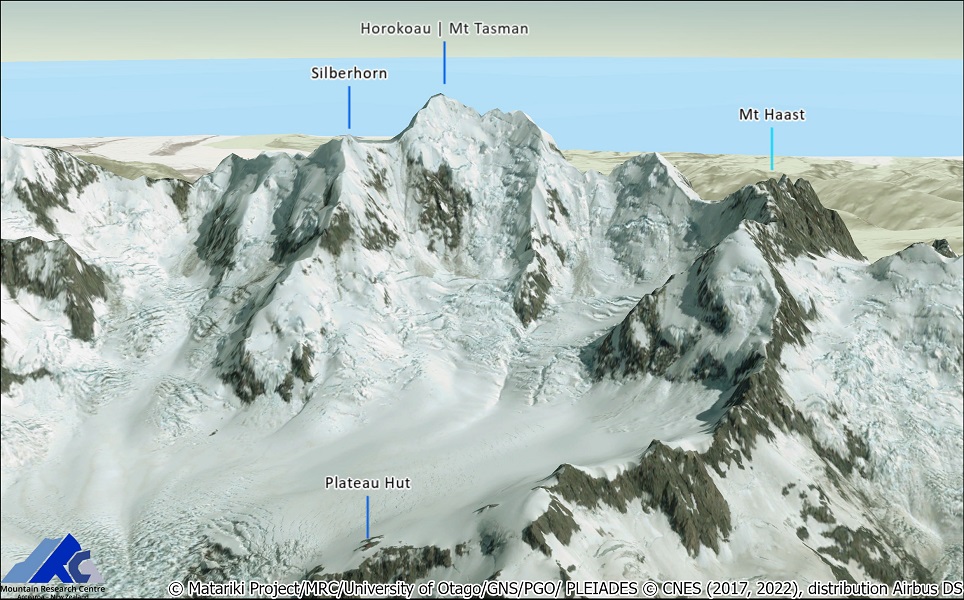
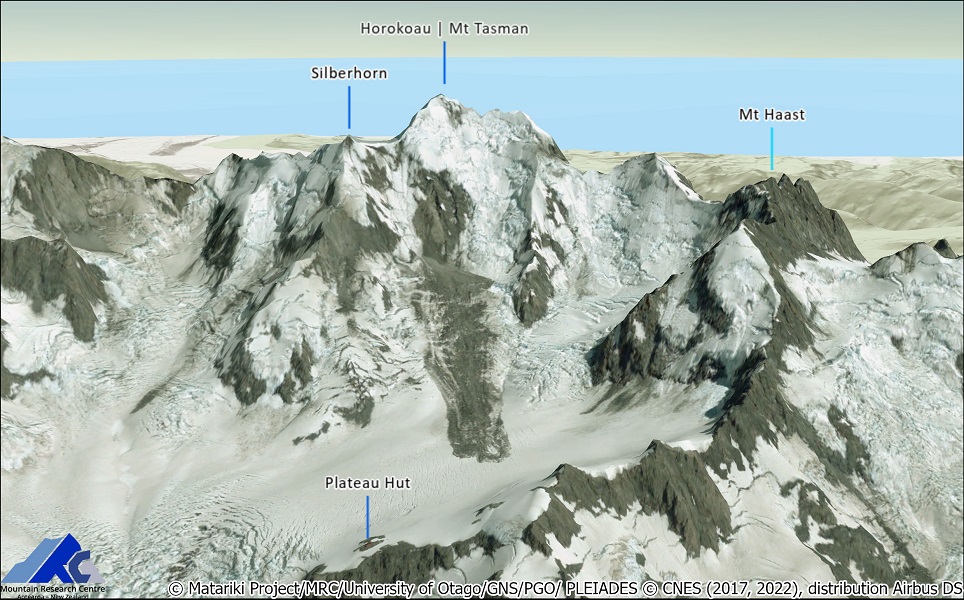
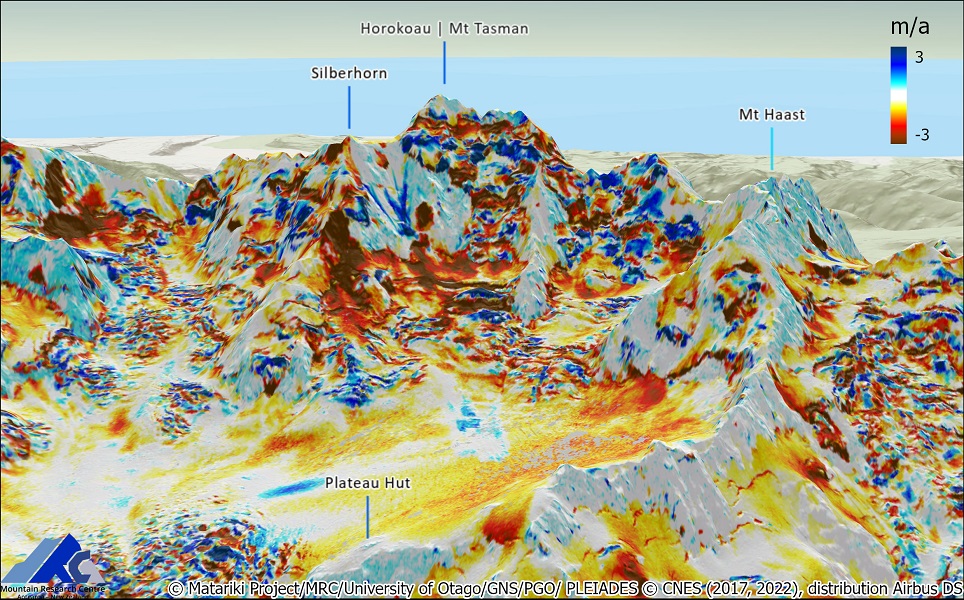
High-resolution (50cm) Pléiades stereo images were captured on February 8 2022 through our collaborators in France (PGO/CNES). The stereo images were rapidly processed into a 2m DSM with the Matariki automated photogrammetry pipeline running on NeSI. Within 48hrs of receiving the imagery, an accurate 3D change estimate was leveraged to update the mass movement inventory maintained by partner GNS Science for further hazard assessment. You can see the new imagery, draped on the 2m DSM from 2022 compared with Pléiades imagery of the same region from 2017 draped on the 2m DSM derived from that stereo-pair. The red polygon denotes the extent of the rock avalanche source area and debris area digitised from the new data. Data credit © Matariki Project/MRC/University of Otago/GNS/PGO/ PLEIADES © CNES (2017, 2022), distribution Airbus DS, GNS Science.
You can interact with the PlanetScope imagery in webmap linked at the bottom of this page. Pan and zoom, and drag the slider to see the different images. Bookmarks zoom to some recent mass movements. Data credit: Planet Labs (2022).
You can interact with the high-resolution 50cm rapid-response imagery in webmap linked at the bottom of this page. Pan and zoom, and drag the slider to see the different images. Bookmarks zoom to some recent mass movements. If you can't see the high-resolution imagery zoom in on the map. Data credit © Matariki Project/MRC/University of Otago/GNS/PGO/ PLEIADES © CNES (2017, 2022), distribution Airbus DS.
Hooker Valley rock avalanche, Aoraki Mount Cook National Park, February 2022
Another large rock avalanche was documented from the same time period in the Hooker Valley from Mt Beatrice and is visible in the PlanetScope image (Planet Labs, 2022).
You can compare the 50cm Pléiades imagery from February 2017 with the rapid-response imagery from February 8 2022. Data credit © Matariki Project/MRC/University of Otago/GNS/PGO/ PLEIADES © CNES (2017, 2022), distribution Airbus DS, GNS Science.
And you can get a glimpse of the level of detail available in the new Pléiades imagery. Here we compare the PlanetScope (3m resolution) ortho image on February 8 with the Pléiades (50cm resolution) image processed through the Matariki pipeline and orthorectified on the 2m DSM from the same day. Data credit © Matariki Project/MRC/University of Otago/GNS/PGO/ PLEIADES © CNES (2022), distribution Airbus DS, Planet Labs (2022), GNS Science.
Finally, you can see how the Hooker Valley has changed over 5 years by comparing the 2m DSM hillshades, derived from the Pléiades stereo images in 2017 and 2022, including the recent failure from Mt Beatrice (red polygon). Data credit © Matariki Project/MRC/University of Otago/GNS/PGO/ PLEIADES © CNES (2022), distribution Airbus DS, GNS Science.
Husky Flat erosion, Aoraki Mount Cook National Park, February 2022
Tasman Glacier lateral moraine erosion, accelerated by a rain event in December 2019, can also be viewed in the new Pléiades imagery and compared with the 2017 imagery prior to the initial erosion. You can compare the elevation profiles from 2017 and 2022 (as well as the 2008) derived from the 2m DSMs. The 3D topographic changes can be used to quantify the volume of material removed and estimate how Husky Stream and other nearby streams are likely to change in the future. Data credit © Matariki Project/MRC/University of Otago/GNS/PGO/ PLEIADES © CNES (2022), distribution Airbus DS, GNS Science.
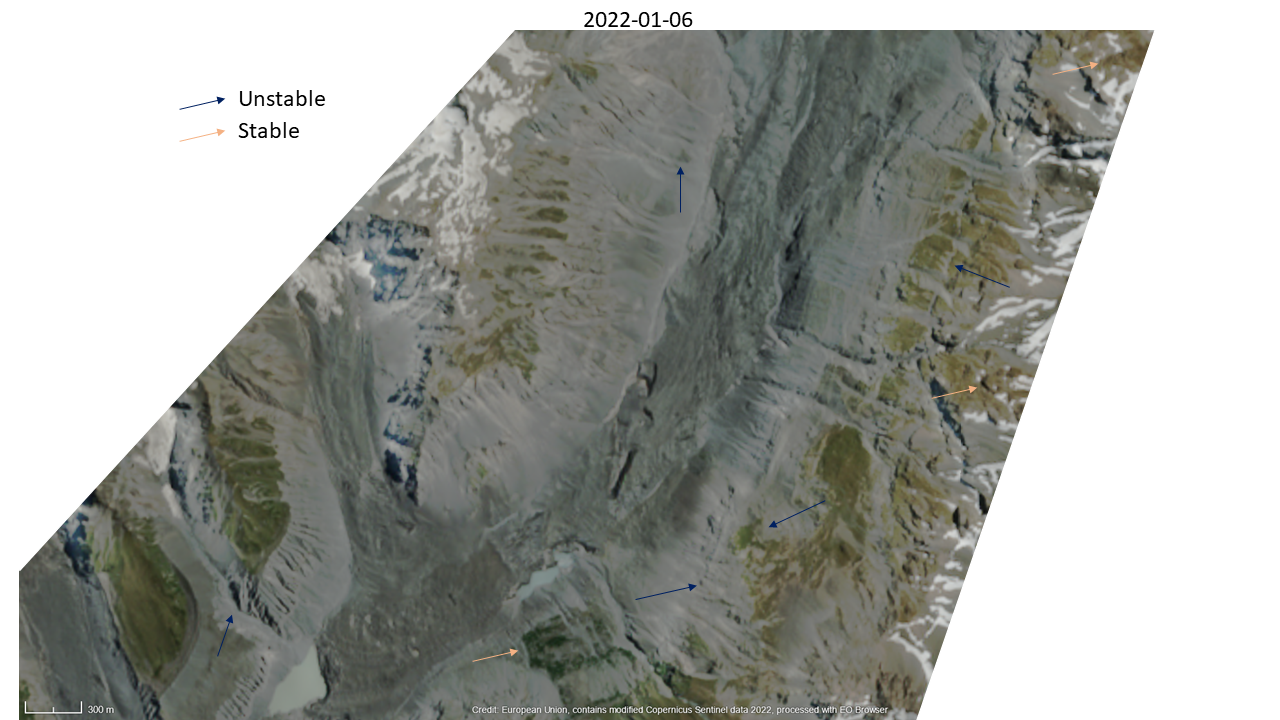
Murchison Valley spreading, Aoraki Mount Cook National Park, January 2022
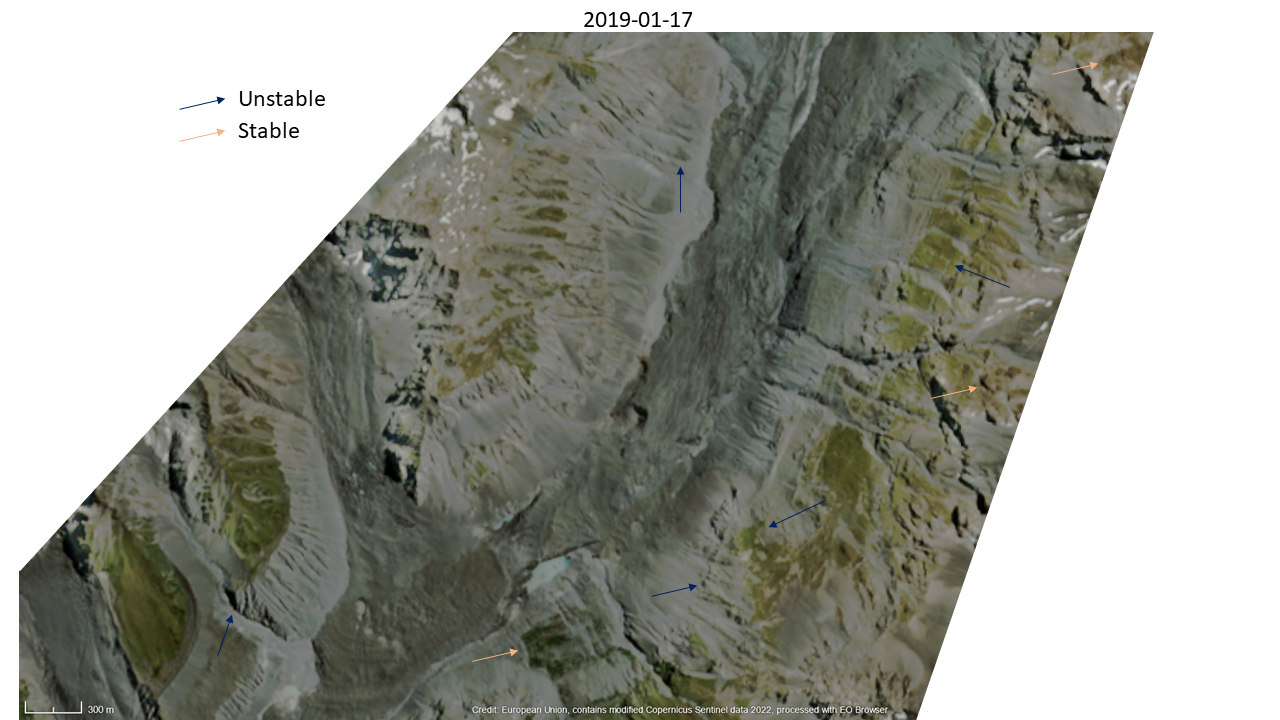
The Murchison Valley continues to spread as seen by comparing Sentinel 2 (ESA) images. The images below were captured on January 6 2022 and January 17 2019.
In mountains we trust.