The University's Evaluation service generate three standard evaluation reports:
- Individual teacher summary report – a summary of responses to the five 'teacher core' ratings questions used to appraise teacher performance
- Paper/course student evaluation report – a detailed summary of all questions asked
- Co‑ordination of tutors/demonstrators summary data report – a summary like the individual teacher report albeit for co‑ordinators seeking feedback from the staff they supervise
By default, reports are returned to the person requesting the evaluation (unless they are ordering on behalf of someone else, in which case the person who the request is for receives it) and the Head of Department (or equivalent) via the email address that has been entered in the 'Results will also be sent to your HoD' field on the request form within Otago inFORM. You can note additional individuals for reports to be distributed to in the 'Final notes' field of the request form.
Comment data
Comment data is reported as written by each respondent. When reading comments, think about how you want to organise them. You might like to code comments to identify themes on what went well and what might work better. Try summarising each theme in a sentence or two along with a typical example. Determine whether the proportions of satisfied and dissatisfied comments represent a minority or majority of the class. Interpret negative comments with caution as they may be due to pressures unrelated to you or your paper.
We ask respondents to provide constructive feedback when completing evaluation questionnaires (e.g., Otago inFORM student home). If you believe, however, that a respondent's comment breaches the University's student code of conduct or its ethical behaviour policy, please contact the Evaluation service, who monitor concerns about evaluations, and either the Proctor's office or the Director of Human Resources as per the policies.
Ratings data
Evaluation reports display the percentage of respondents who chose different options for each of the closed, rating-type questions. By default, the left end-point descriptor on each five-point Likert scale reflects the most positive response and the right end-point descriptor the least positive. To report an overall impression, percentages are combined for the two left-most responses (1s and 2s) to summarise the most positive responses, the 3s reflect the middle response, and the two right-most responses (4s and 5s) combine to summarise the least positive responses.
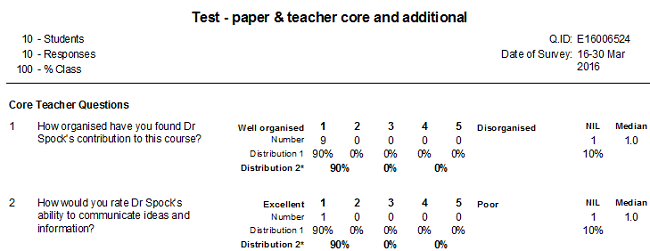
The paper/course evaluation report provides the most detail (see figure 1). It displays the:
- Number of responses to each of the two or five rating options
- Number who did not respond to the current rating question but did respond to other questions (counted as NIL responses)
- Percentage of responses to each rating and NIL options (shown as 'Distribution 1')
- Percentage of responses when combining the most (1s and 2s) and least (4s and 5s) positive options (shown as 'Distribution 2')
- Interpolated median, or median where more appropriate (shown as 'Median')
Figure 1: Paper/Course evaluation report template (partial)
Additional teacher evaluation metrics
Since Jan 2020, individual teacher summary reports have added metrics for both teacher core question 5 (Overall, how effective have you found [Teacher's name] in teaching this course?) and response rates. This document explains the additional metrics.
Additional teacher evaluation metrics (PDF)
Percentages that don't add to 100
Rounding may explain why percentages add to 99 or 101 instead of 100.
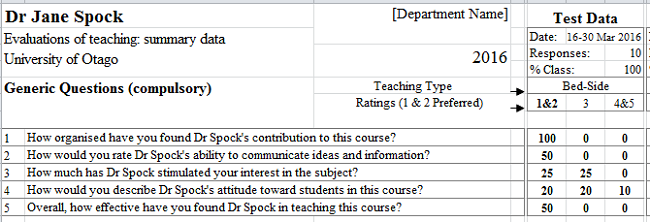
Percentages may also add to less than 100 to reflect NIL responses which are not explicitly recorded on either the individual teacher or co‑ordinator reports. For example, if everyone in a class of 10 responded to question 1 but only half responded to the other 4 questions, and all gave positive responses to questions 1, 2 and 5, an individual teacher report would show 100% 1s and 2s for question 1 and 50% 1s and 2s for questions 2 and 5 (see figure 2). To show 100% 1s and 2s for questions 2 and 5, instead of 50%, would hide the fact that half of the respondents failed to answer the question. For this reason, the values shown are proportions of all who have responded to any of the rating-type questions.
Figure 2: Individual teacher report template (partial)
Reporting different response rates for the same evaluation
Since 1 April 2016, the Evaluation service has provided both paper/course and individual teacher reports for questionnaires that include the 6 core questions (5 rating and 1 comment). In rare circumstances, the headline response rates on these reports may differ even when they summarise the same questionnaire. This is because the individual teacher report only summarises responses to the 5 core rating questions, whereas the paper/course report also summarises online comment data. For example, if 9 students in one class complete the ratings questions and 1 student completes only the comments questions, the number of responses on the individual teacher report would be 9, to reflect the number of students who responded to rating-type questions. In contrast, the number of responses on the top of the paper/course report would be 10, to reflect the number of students who responded to any of the questions.
The paper/course report counts comments-only respondents because, unlike the individual teacher report,
(a) it explicitly details the number of responses to each ratings question (which, in this example, would be 9 and match the count in the teacher report), and
(b) it may be summarising questionnaires that only contain comments questions, and if it didn't count them, these paper/course reports would always show zero responses irrespective of how many actually gave written feedback.
To order a questionnaire:
Contact
Evaluation office
Tel +64 3 479 7581
Email evaluation@otago.ac.nz